What is a Rating Curve ?
Rating Curve
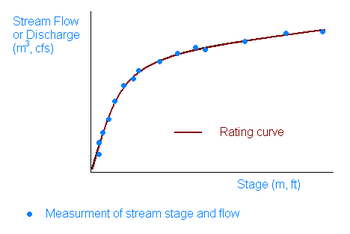
A rating curve is a plot of the stage of the water versus the flow that the stream had at that stage. An example of a rating curve is shown in the following figure.

The stage is the height of the water surface above some datum point, which is usually taken as the deepest point in the stream channel. (Difference between Stage and Depth)
Importance of Rating Curve
Hydrologists very often need to know flow rates in streams under many different conditions but they do not have the time or resources to go into the field and measure these flow rates continually. Instead, they often rely on rating curves to give them this information. When the time and energy is taken to directly measure stream flow (using sections) at a given point in a stream, the stage of the water is usually recorded at the same time. Using these data points of the water elevation (stage) and the measured flow rate, hydrologists can produce a rating curve.
In the office, hydrologists can easily obtain the stage of a stream by satellite and use a rating curve to determine what the corresponding flow rate is. Determining the stage at a point in a stream is much less labor intensive than repeatedly making velocity and depth measurements over the width of the channel because they can get this data from the computer. Stream gages are automated recording devices situated along the banks of streams to continually record the stage of the water over time. Most of the data from these stations is sent in real-time via an earth-satellite-based communications system to water resource agencies. In this way, hydrologists can determine flow rates essentially from their office, although there are some limitations to determining flow rates this way. Following figure shows a picture of a stream gaging station.
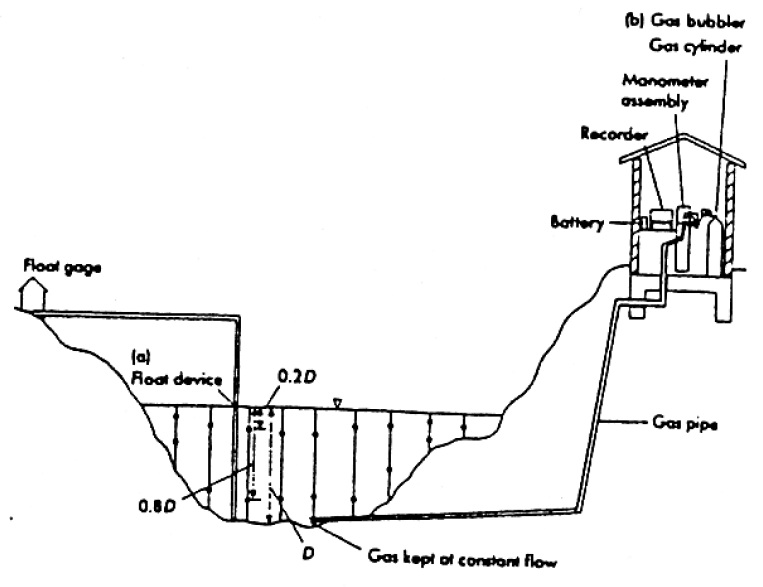
A stream gaging station usually looks like a little house or a box which has enclosed within it an automatic water-level recorder. Float-type devices or gas bubblers are two common devices used to determine the stage. The float-type approach is an old method, but is still used in some areas.
With the float-type device, a recorder is placed above a stilling well which is hydraulically connected (by a pipe) to the stream. The bottom of the stilling well is assumed to be located at the same depth as the bottom of the streambed. Water automatically enters the pipe and fills the stilling well until the depth of water in the stilling well is equal to the depth of water in the stream. A float is located at the surface of the water in the stilling well. This float is attached by wire around a pulley to a drum in the upper chamber. The drum is covered by a strip chart or piece of paper onto which measurements can be recorded. The float moves up and down with the stilling well water level, which fluctuates with the changes in the stage level of the stream. The drum rotates as the float rises and falls, and a clock-driven pen marks the stage at specified times of the day. The stream gage therefore gives us a continuous record of the stage of the stream over time.
Float-type devices are gradually being updated to other devices such as gas bubblers. A continuous stream of air is slowly forced into the stream through a small underwater pipe. A bubble gage is used to maintain this constant flow of air, even if water pressure increases or decreases due to changes in water level. A manometer records these changes in air pressure that are required to maintain a constant flow of air, which reflect changes in stage level.
There are some important things to remember about using stage data to determine the flow in a stream. First, each gaging station location along the stream bank has its own characteristic rating curve which was created using several stage and flow rates measurements made at that particular site. Therefore, each rating curve can be used to determine the flow rate at that site only. Second, since a rating curve is created using data over a long period of time, it is assumed that the cross-sectional area of the stream at the stream gage has not changed over time. Since the time of the last streamflow measurement, a storm causing a large flow and a high velocity may have come through and taken much of the streambed with it, changing the cross-sectional area substantially. Therefore, rating curves must be continually updated to reflect these physical changes.
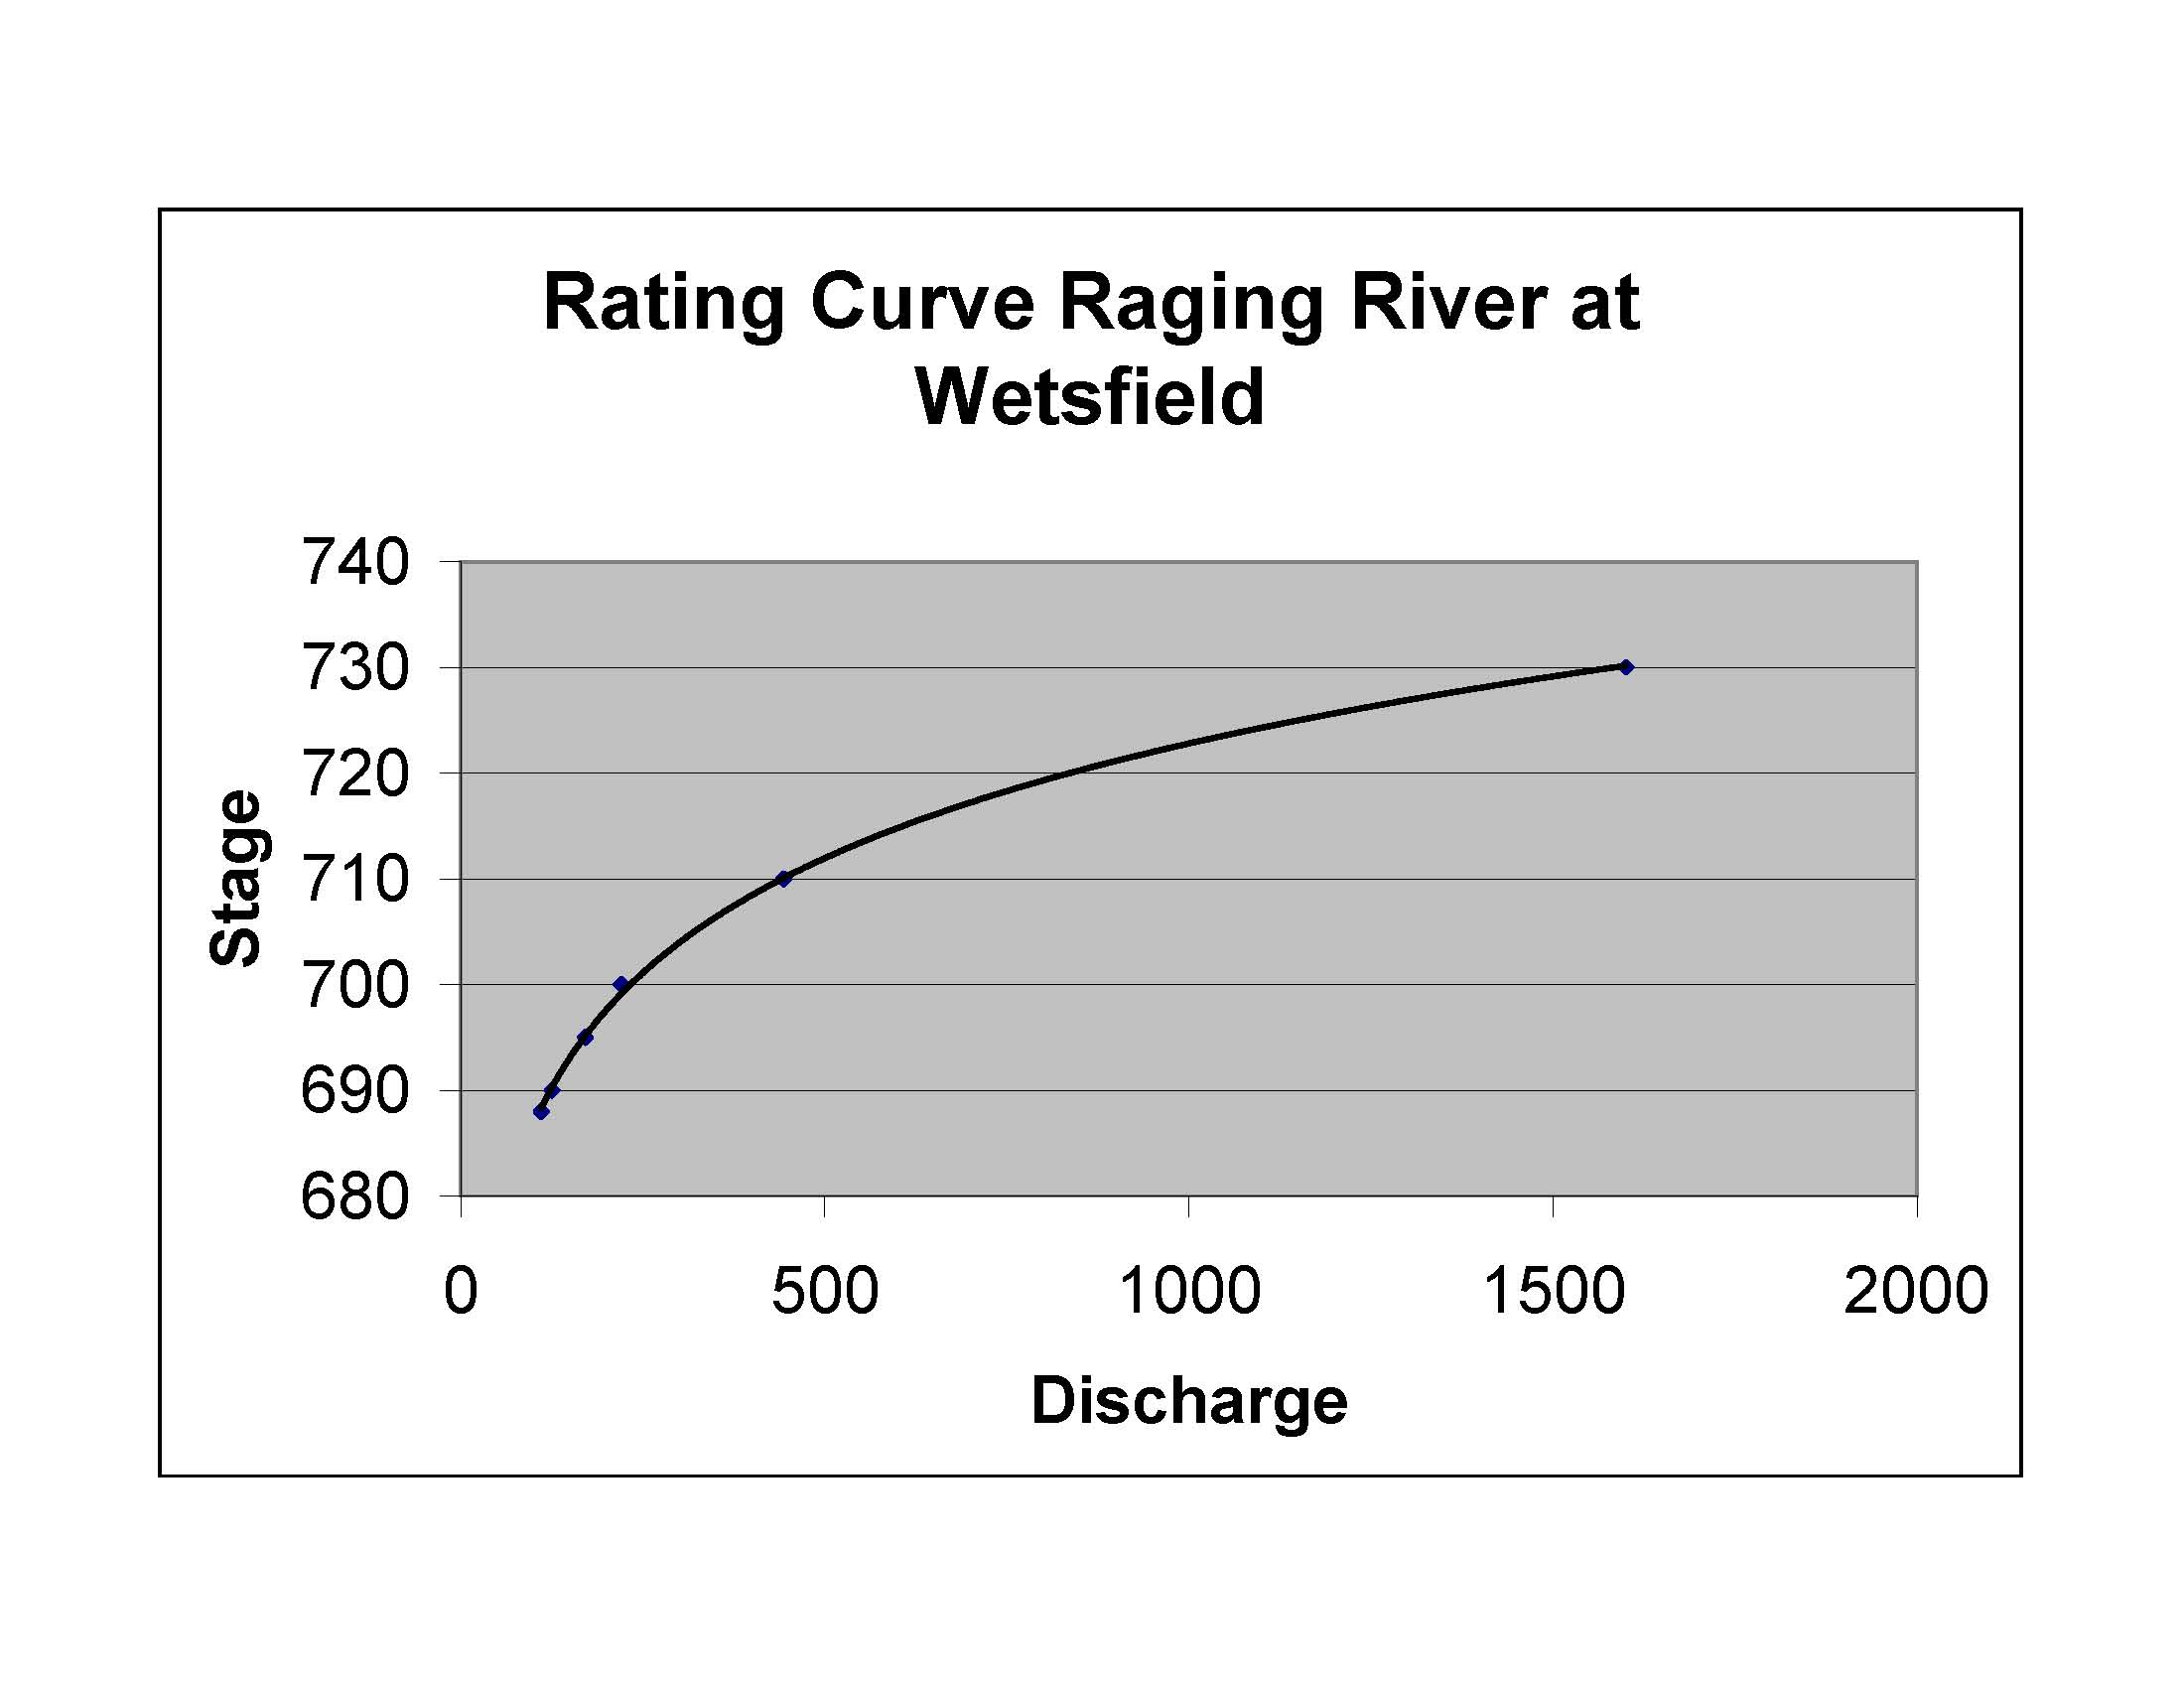
Some More Rating Curves