A study of Spectral Reflectance of Different Objects
1. Introduction Spectral Reflectance
1.1. Electromagnetic Interaction
When a photon does encounter an atomic particle, it transfers energy to the particle. The energy may be remitted back the way it came (reflected), scattered in a different direction or transmitted forward into the material. Let us first consider the interaction of visible light. Reflection and transmission of light waves occur because the light waves transfer energy to the electrons of the material and cause them to vibrate.
If the material is transparent, then the vibrations of the electrons are passed on to neighbouring atoms through the bulk of the material and remitted on the opposite side of the object. If the material is opaque, then the vibrations of the electrons are not passed from atom to atom through the bulk of the material, but rather the electrons vibrate for short periods of time and then remit the energy as a reflected light wave. The light may be remitted from the surface of the material at a different wavelength, thus changing its colour.
1.2. Spectral Response
It is the relative efficiency of detection, of light or other signal, as a function of frequency or wavelength of the signal.
1.3. Remote Sensing
It is the science of obtaining information about objects or areas from a distance, typically from aircraft or satellites.
1.4. Objective
The objective of this exercise is to study the spectral response of different objects and to differentiate them according to their reflectance and understand their behavior. The benefit of this exercise will be seen when we will have a multi-spectral remotely sensed image. Then reflectance signals recorded in that image for each pixel in various band can be plotted in Z-profile using any image processing software (eg ENVI, WinAsean).
2. Reflectance Measurement
2.1. Softwares Used
- RS3 software
- View Spec Pro
- Microsoft Excel
are used to see the comparison of reflectance of different objects with respect to wavelength.
2.2. Objects Studied
Hand Held 2 Spectroradiometer (Figure 2) was used to determine the reflectance of following objects.
- Plant 1
- Plant 2
- Soil
- Chips Floor
- White Round Disk
- Iron Pipe
- Vegetation
- Iron Pipe
- Tree
- Brick Wall
2.3. Procedure
- Install RS3, View Spec Pro Softwares in your Laptop.
- Study the manual to operate the instrument.
- Open the instrument and connect it to your laptop.
- Take out the white disk given with the instrument for calibration.
- Take the instrument and laptop to somewhere out in day light
- First press DC ( Dark Current ) button while pointing the sensor of instrument towards the shite disk. A shutter sound will be heard.
- Press the WR (White Reference ) button while pointing the sensor of instrument towards the shite disk. A shutter sound will be heard.
- Now the instrument is ready to take reading of other objects.
- Point different objects one by one and save the images in instrument and remember the sequence for analysis afterwards.
- Inn our case two reading were taken for each object then average of both was used.
- View Spec Pro graph can be seen in the following image
- The data was exported to text files for manual graph making on Microsoft Excel.
- All test files were imported on Microsoft Excel and average was taken of two same objects.
- Reflectance was calculated by dividing each spectrum value of an object to that spectrum value of white disk.
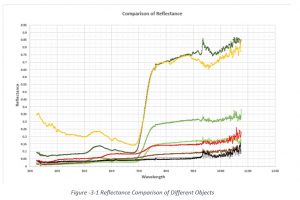
- Scatter line graph was made to observe the difference in the reflectance of all objects which can be seen in the following image.
3. Results
Figure 3.1 shows a comparison of spectral reflectance of various objects.
4. NDVI’s
Normalized Difference Vegetation Index is one of the most popular indices to get the information about the vegetation cover on ground. It shows the difference of reflectance in infra red band and in red band (i.e.) Band 7 & Band 5 of Landsat MSS. It can be calculated as
NDVI = (NIR – RED)/(NIR + RED)
The NDVI’s of all the materials under study have been calculated using Microsoft excel and is available with all the calculations. The following results have been obtained after the calculations.
5. Discussion and Conclusions
The trends observed in this experiment (Fig 3.1) are same as in literature Fig (4.1) which means the experiment performed is correct and the values can be studied later on. The soil behavior is also same it increases in reflectance with the increase in wavelength. Vegetation and trees have a typical behavior. The spectral Reflectance increases abruptly in Infrared zone. Chips and iron pipe are not having much difference. Brick wall can be indicated easily as it’s a straight line in the red frequency range from 0.6 to 0.7.
The above two peaks are for grass and tree and their reflectance is greater than that of plant 1 and 2, the reason of this very high reflectance is that the instrument was calibrated not in direct day light but under a corridor while the reading was taken in open area and day light. Similarly the NDVI’s of Grass and Tree are very high as compared to other values because of the very same reason that those observations were taken under sunlight. The instrument should have been calibrated at that amount of light before taking reading there. Overall it was a good experiment and I have enjoyed doing this.
6. References
- https://www.nde-ed.org/EducationResources/CommunityCollege/RadiationSafety/theory/interaction.htm
- FieldSpec®HandHeld™2 Spectroradiometer User Manual, 600860 Rev.D” by ASD Inc., USA, 2010.
- https://crisp.nus.edu.sg/~research/tutorial/intro.htm
- Laboratory Exercise 2 for Spectral Reflection of Objects by Noor Muhammad Khan, 2004.
Spectral Reflectance, Spectral Reflectance, Spectral Reflectance, Spectral Reflectance, Spectral Reflectance, Spectral Reflectance, Spectral Reflectance, Spectral Reflectance, Spectral Reflectance, Spectral Reflectance, Spectral Reflectance, Spectral Reflectance, Spectral Reflectance, Spectral Reflectance, Spectral Reflectance, Spectral Reflectance, Spectral Reflectance, Spectral Reflectance, Spectral Reflectance, Spectral Reflectance


